Start here first
Not sure the fleet is ready for detailed TCO modelling?
Before running detailed cost scenarios, use the Fleet Decarbonisation Readiness Score. It checks operational fit, site readiness, commercial timing, internal ownership and data confidence so you know whether the right next step is modelling, break-even analysis or advisory.
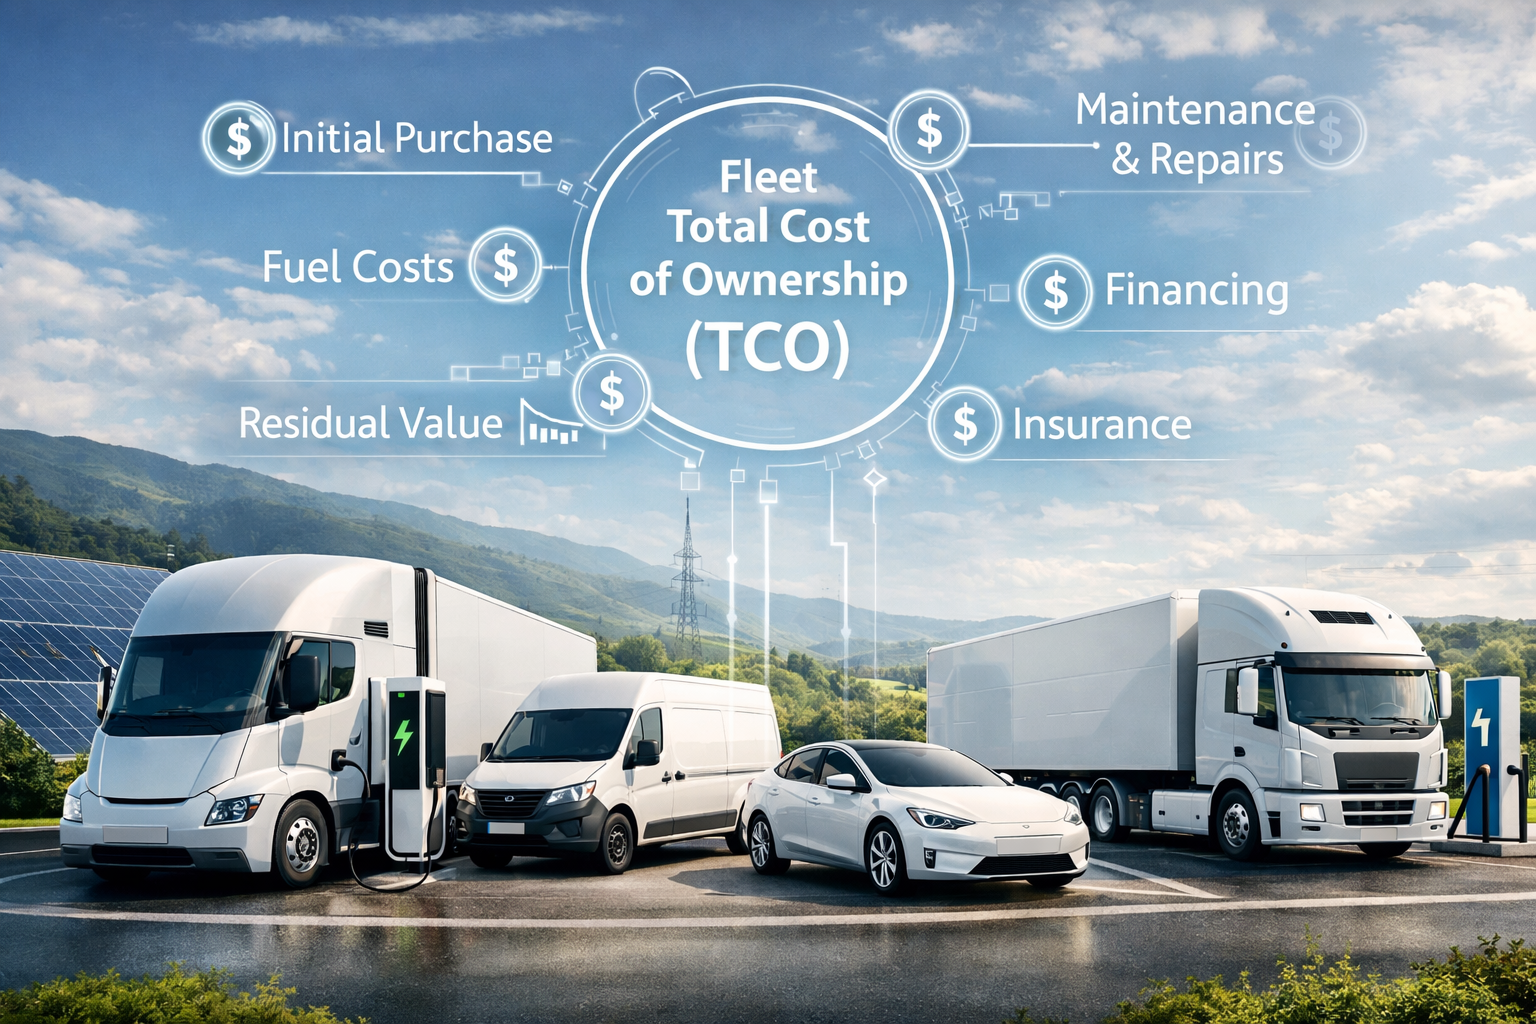
Fleet TCO is not just a vehicle price comparison
Most fleet decarbonisation conversations still start in the wrong place. They compare vehicle prices, fuel prices or sticker-price parity headlines and then assume the economics will follow. In practice, total cost of ownership is shaped by a much wider set of variables: utilisation, route intensity, payload, charging or refuelling downtime, infrastructure cost, driver requirements and the number of vehicles you actually need to deliver the same work.
That is why fleet TCO matters. It is not simply an accounting exercise. It is the point where technology choice meets operational reality. If the utilisation assumptions are wrong, if the route profile is unrealistic, or if charging time quietly forces extra vehicles and extra drivers into the model, the economics can swing very quickly.
The right question is not “Which drivetrain is cheapest on paper?” It is “What does it cost to deliver the required workload, under real operating conditions, with a fleet structure that can actually work?”
Use the right tool in the right order
This page explains the logic behind fleet TCO. If you want to run the numbers, use the Commercial Fleet TCO Calculator.
If the live question is where diesel, battery electric and hydrogen cross over as mileage, energy price or ownership period changes, use the Break-Even Analysis tool.
If you are still unsure whether the fleet is ready to move into detailed modelling at all, start with the Fleet Decarbonisation Readiness Score.
What actually drives fleet TCO
In most real fleets, TCO is driven by capital cost, energy cost, asset utilisation, labour cost and infrastructure. Each of those is simple in isolation. The difficulty is that they interact.
A battery-electric truck may have lower maintenance and lower energy cost per mile than diesel, but if charging time reduces daily productive mileage, you may need more vehicles to do the same work. Once that happens, capex rises, driver costs rise and the infrastructure burden increases at the same time. A model that ignores that interaction is not really modelling fleet economics; it is modelling a simplified fuel switch.
Hydrogen changes the shape of the problem rather than making it disappear. Refuelling time is much closer to diesel, which helps protect utilisation on high-intensity routes, but vehicle cost, fuel price and fuelling infrastructure may still weaken the case unless the operating profile is demanding enough to justify it.
That is why the same fleet can produce completely different TCO answers depending on route intensity, dwell time, depot control, charging strategy, driver assumptions and replacement timing. These are not side issues. They are the economics.
Why simple TCO models go wrong
The most common problem with simplified TCO models is that they assume a one-for-one vehicle replacement and then compare energy costs across technologies as if the operating model stays constant. That can be useful for a first pass, but it often breaks the moment you introduce real route constraints.
A realistic fleet model has to ask harder questions. How much route work can a vehicle actually cover in a day? How much productive time is lost to charging or refuelling? Does payload loss create more trips? Do additional vehicles create additional driver costs? Do infrastructure delays or site constraints change the timing of the switch altogether?
Those questions matter because they usually determine whether a project is merely interesting in principle or actually deployable in practice.
The practical sequence
- Use the Readiness Score to test whether the fleet is actually ready for serious transition planning.
- Use the TCO Calculator to model delivered cost under realistic operating assumptions.
- Use the Break-Even Analysis tool when the answer depends on where those assumptions cross over.
TCO is a strategy tool, not just a finance tool
For fleets, investors and infrastructure providers, TCO is where strategic claims meet operational discipline. It forces a project to move beyond generic decarbonisation language and into questions of route fit, contracted demand, financing structure, energy supply and delivery risk.
That is why good TCO work should not be treated as a standalone spreadsheet exercise. A model can be numerically tidy and still be strategically useless if the assumptions behind it are weak. Equally, a project can look difficult on first inspection and still become viable once the fleet mix, route profile or infrastructure approach is changed.
In other words, the purpose of TCO is not to produce a neat answer. It is to identify which operating model can actually support a viable transition path.
Next step
Ready to test a real fleet scenario?
Run the Commercial Fleet TCO Calculator for a worked cost view, use Break-Even Analysis if the economics are sensitive, or start with the Readiness Score if the real issue is whether the fleet is ready for modelling in the first place.