
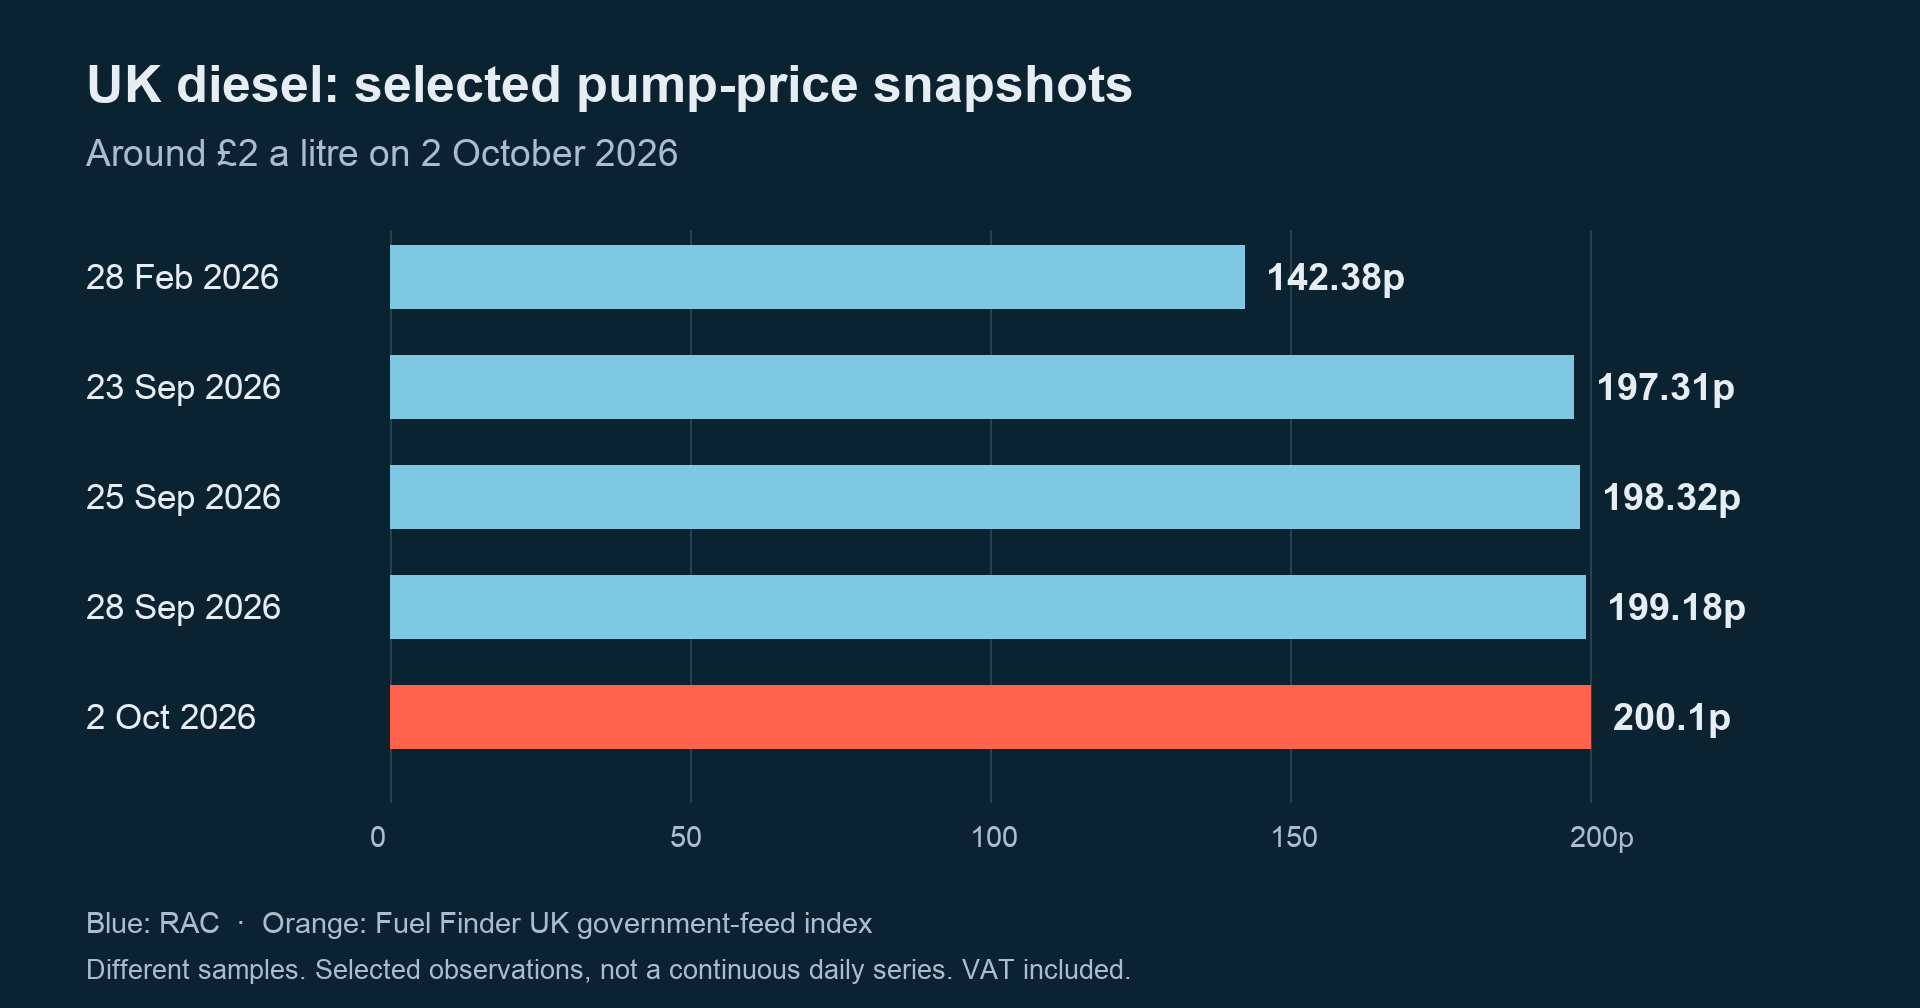
UK diesel prices have risen from about 142p to around £2 a litre in seven months. For an articulated truck covering 75,000 miles a year, sustaining that increase would add roughly £19,400 to annual fuel costs after recoverable VAT. That is more than five times the RHA’s indicative 2024 benchmark of £3,500 annual profit per lorry. With margins around 2% and only one in ten operators reporting full recovery of higher fuel costs from customers, who pays the difference?
Summary
A £19,400 annualised fuel increase is large relative to a haulier’s normal profit. Operators can recover some of it through higher rates and fuel surcharges, absorb some in their margins, or share the burden with customers. Where freight customers pass their own higher costs on, consumers eventually pay part of the bill. Where recovery fails, cashflow and business survival come under pressure.
£2 diesel is not a normal cost increase
The RAC’s 28 September figures put diesel at 199.18p a litre, against 142.38p on 28 February. The RAC Foundation reported the £2 threshold being crossed on 30 September; Fuel Finder UK’s 2 October index showed 200.1p. The calculation below uses the two dated RAC observations, a 56.8p increase including VAT.
Consider a 44-tonne articulated heavy goods vehicle (HGV) travelling 75,000 miles a year and 8.3 miles per imperial gallon. These match the RHA’s Cost Tables 2026. One imperial gallon is 4.54609 litres, so annual consumption is 75,000 ÷ 8.3 × 4.54609 = 41,079 litres, or about 41,100.
The £2 diesel problem
75,000 miles/year · 8.3 imperial mpg
≈41,100 litres of diesel/year
Diesel: 142.38p → 199.18p/litre
RAC: 28 February → 28 September 2026
≈£19,400 per truck
Additional annual fuel cost after recoverable VAT
≈£972,000 for 50 trucks
Annualised: if the higher price persists for a full year.
Typical haulage margin: ≈2% · Operators fully able to pass higher fuel costs on: ≈10%
RHA, September margin benchmark; RHA, June pass-through findings.
The reproducible calculation is 41,079 × £0.568 ÷ 1.20 = £19,444 per truck. The division removes VAT from the VAT-inclusive pump-price change. Using unrounded litres, 50 identical trucks give £972,206. These are annualised increases if the price difference lasts a full year, with fuel VAT fully recovered as permitted for business-only vehicles. They are not costs already incurred.
The RHA’s September commentary describes typical haulage margins of 2%. Its 2024 policy analysis associated that margin with about £3,500 annual profit per lorry. Against that older indicative benchmark, the £19,444 fuel increase is roughly 5.6 times annual profit.
Fuel escalators, contract terms, bulk purchasing, hedging, utilisation and negotiated rate increases determine how much an individual operator absorbs. A cost increase several times normal profit cannot be absorbed indefinitely without changing the economics of the work.
| Pump-price increase (VAT included) | One truck gross purchases | One truck after VAT recovery | 50 trucks after VAT recovery |
|---|---|---|---|
| 10p | £4,108 | £3,423 | £171,163 |
| 25p | £10,270 | £8,558 | £427,908 |
| 50p | £20,540 | £17,116 | £855,815 |
| 56.8p: RAC February → 28 September | £23,333 | £19,444 | £972,206 |
Who pays?
The RHA’s 4 June survey release reported 84.6% experiencing margin reductions, 56.8% reporting cashflow pressure, and 39% confident of continued operation under prevailing fuel pressures. It had 550 responses, 90.6% from small or medium-sized fleets, and covered haulage, coach and van businesses. These are June findings from responding road-transport firms.
The association’s 11 June account reported that only 10% were fully able to pass increased fuel costs to customers. That leaves a large gap between paying for dearer diesel and recovering it in revenue.
The haulier absorbs it. An unchanged freight rate leaves the additional fuel cost in the operator’s accounts. Profit falls, and the business must finance the higher cash outlay. Cutting investment may conserve cash for a while, but it does not remove the cost of the next delivery.
The customer pays. A negotiated rate increase or fuel surcharge transfers part of the burden to the shipper. Fuel-adjustment clauses can index rates to a published benchmark, with a base price and agreed review dates. The RHA tables include a specimen agreement. Coverage and timing determine how much protection it provides.
A contractual lag leaves the haulier financing expensive fuel before the revised rate is paid. Even successful recovery can therefore protect the eventual margin while putting pressure on working capital. Fixed-price work and customers resisting renegotiation leave more of the increase with the operator.
The consumer eventually pays some of it. A manufacturer, wholesaler or retailer facing higher freight charges can absorb them in its own margin or raise selling prices. The burden normally spreads across these channels. Passing the cost out of haulage does not make it disappear; it changes whose margin or purchasing power bears it.
Were operators prepared for £2 diesel?
There appears to be no reliable industry-wide dataset showing how many UK hauliers budgeted for £2 diesel in 2026. The available evidence does show the much lower fuel-price environment in which recent costing models and commercial discussions took place.
The RHA’s 2026 cost tables used a blended bulk-and-card fuel average of 107.87p a litre excluding VAT for the year to September 2025, down from 113.46p a year earlier. Its 2025 cost-movement report explicitly discussed customers seeking reductions after fuel costs had fallen, while recommending fuel-adjustment clauses in contracts.
A March 2026 RHA costing study used diesel at £1.06 a litre excluding VAT, drawn from its member fuel report for the week ending 23 January. The RHA cost tables’ September 2025 model put fuel at 20.98% of total costs for a 44-tonne combination.
February’s RAC pump price equated to 118.65p excluding VAT; 199.18p equates to 165.98p. Bulk procurement and pump-price averages are different benchmarks, but the dated figures show how far the market has moved beyond the recent costing environment. They support a conclusion about the scale of the shock, not a claim that a particular percentage of operators failed to plan.
Why UK diesel prices have reached £2 a litre
The cost over which operators have so little control begins well before a road tanker reaches a fleet bunker. Crude can arrive at a British refinery and leave as diesel, or an overseas refinery can produce the finished fuel that a tanker brings to a UK import terminal. Both routes expose UK diesel prices to international markets.
The government’s 2025 security-of-supply report says UK refiners supplied 54.9% of road-diesel demand in 2024. The US, Netherlands and Belgium accounted for 72.5% of diesel imports that year. The newer DUKES 2026 account, covering 2025, puts those three suppliers at approximately 68% combined. Britain depends materially on traded refined diesel.
Grangemouth stopped refining in April 2025 and became an import and distribution terminal. DESNZ also records Lindsey’s closure in 2025. These changes increased exposure to overseas refining; one closure alone does not explain the present shock.
- Crude production and transport
Oil wells → pipeline or crude tanker. International crude prices and route risk enter here.
- Refinery
UK or overseas plant converts crude into a product mix. Capacity, utilisation and outages limit diesel output.
- International diesel market
Finished-fuel pricing, crack spreads and export restrictions affect both domestic and imported supply.
- UK refinery outlet or import terminal
Finished diesel enters UK storage; imports also carry shipping and currency exposure.
- Distribution terminal and road tanker
Fuel moves to a filling station or fleet bunker.
- HGV → customer → consumer
Transport costs reach the shipper, then potentially the price of goods. Contracts and margins determine pass-through.
Original explanatory diagram. The first four stages expose Britain to international pricing or import supply.
Crude prices set the feedstock cost, but working refinery capacity determines how much finished diesel reaches buyers. Maintenance, outages and damage can reduce output even where crude is available. The Bank of England’s September minutes describe refinery pressures keeping refined-product premiums well above their pre-conflict levels.
International disruption has tightened supply. Middle Eastern disruption affects crude routes and refineries. Bloomberg reported on 30 September that Russia extended restrictions on producers’ diesel exports through October following refinery disruption. Reuters reported on 1 October that Chinese refiners suspended product exports beyond Hong Kong and Macau until further notice, citing four people briefed on the decision.
Replacement cargoes can travel farther and carry higher freight and insurance costs. As the RAC explains, traded refined fuel is priced in dollars, so a weaker pound increases its sterling cost. Distribution, wholesale and retail margins are added along the route.
Fuel duty remains 52.95p a litre through December 2026, and VAT is 20%, applied to the price including duty. At £2 a litre, VAT is about 33.3p. The haulier pays the VAT-inclusive bill first, then recovers eligible VAT; its economic fuel cost is lower than the pump quotation, but its cash requirement arrives immediately.
Why cheaper crude need not mean cheaper diesel
A diesel crack spread is the difference between the wholesale price of diesel and the price of crude oil, measured on an equivalent barrel basis. A wider spread means finished diesel has become more expensive relative to its feedstock.
More crude helps an operating refinery obtain raw material. It does not repair a damaged processing unit, reverse an export restriction or instantly replenish diesel stocks. A refinery also produces a mix of fuels, as the US Energy Information Administration explains; its whole throughput cannot become diesel on demand.
Britain can therefore have access to crude while finished diesel stays expensive. For a haulier negotiating a fuel surcharge, a fall in the headline oil price is insufficient evidence that its own fuel bill has recovered.
The inflation dilemma
If hauliers absorb the increase, margins and cashflow take the hit. If customers accept higher rates, haulage costs rise. If those customers pass them on, some of the increase reaches consumer prices. Competition and demand determine how far and how quickly it travels.
Household petrol and diesel purchases also enter inflation directly. The latest ONS bulletin covers August 2026: CPI rose from 2.9% in July to 3.1%, and CPIH, which includes owner-occupiers’ housing costs, from 3.1% to 3.3%. Transport, especially motor fuels, made the largest upward contribution to the change in annual inflation. Motor-fuel prices were 23.0% higher than a year earlier.
Higher HGV fuel costs are an indirect channel, entering prices through supply chains. In her 24 September speech, Bank deputy governor Clare Lombardelli recalled an April projection that indirect energy effects would add about 0.3 percentage points to August CPI inflation. Observed pass-through had been smaller or slower. That was a wider-energy estimate, not a measured diesel-only contribution.
A sustained shock can also influence wage demands, inflation expectations and broader business pricing. Those second-round effects can make inflation persist after the first increase in fuel costs. The Bank judged it too early to establish their scale. Monetary policy faces the risk of persistent inflation alongside the weaker spending caused by lost purchasing power.
Food shows how the cost travels
A food product may move from farm → processor → distribution centre → supermarket, with diesel-powered HGVs on several legs. Higher haulage rates can enter the processor’s costs, then the distributor’s and retailer’s. Each business decides how much to recover from the next customer.
Those extra transport costs sit alongside ingredients, labour, packaging and other energy costs. Diesel contributes to the pricing pressure; the increase in a truck’s fuel bill is not an equivalent percentage increase in the price of food.
A fuel shock in a financially fragile sector
The latest Insolvency Service tables record 259 company insolvencies in freight transport by road and removal services in England and Wales from January to August 2026, against 294 in the same months of 2025. April recorded 45, compared with 34 a year earlier. These are the current provisional, unadjusted sector counts in Table 1c, released on 18 September.
Failures remain substantial, although the year-to-date total is lower. The fuel shock has arrived in a sector already operating on thin margins and facing labour, financing and other operating-cost pressures. The insolvency data do not isolate how much diesel contributed to any individual failure.
For an operator unable to recover the increase, the adjustment can mean lower investment, fewer viable contracts, reduced capacity or financial distress. That puts practical limits on the idea that hauliers can keep accepting higher costs while customers retain unchanged rates.
Who carries the energy-price risk?
A five-to-eight-year vehicle decision commits an operator to more than a fuel price on the day of purchase. Diesel exposure combines global crude markets, refinery capacity, finished-product availability, geopolitics, shipping, currency movements and tax. Most of those variables lie outside a haulier’s control.
Expected fuel cost is the central budget assumption. Volatility is the range of bills the business may actually face. Pass-through determines how much it can recover from customers. Supply security concerns having usable fuel where it is needed. Contracts determine who finances and ultimately bears the risk.
These distinctions belong in fleet decarbonisation economics. The useful question for an alternative drivetrain is what reducing diesel-price exposure is worth over the vehicle’s life. Hydrogen and electricity have their own price, infrastructure and contractual risks. Comparing those risks requires the delivered-cost analysis discussed in hydrogen economics, battery-swapping economics and energy infrastructure.
At the February benchmark, this truck’s annual fuel cost would have been about £48,700 after recoverable VAT. At the September benchmark, it becomes about £68,200. The extra £19,444 has to land somewhere if the price difference persists.
In an industry earning margins around 2%, that money cannot disappear into the accounts indefinitely. The haulier accepts lower profit, the customer pays a higher freight rate, the consumer pays some of the onward increase — or work and businesses become unviable. With UK diesel prices around £2 a litre, the argument is about who carries the extra £20,000.
Frequently asked questions
How much does £2 diesel add to an HGV’s annual costs?
For the example here, 75,000 miles at 8.3 imperial mpg consumes about 41,100 litres. The increase from 142.38p to 199.18p adds about £19,400 after recoverable VAT if it lasts a full year, or about £972,000 for 50 trucks.
Can hauliers pass higher fuel costs to customers?
Fuel-adjustment clauses and negotiated rates can recover some or all of the increase. The RHA’s June account reported only 10% fully able to pass higher fuel costs on. Recovery can also lag behind the fuel payment.
Does cheaper crude immediately reduce diesel prices?
Diesel also depends on refinery output, export policy, inventories and delivery costs. A wide diesel crack spread can keep the finished fuel expensive relative to crude.
Sources and evidence notes
- RAC — Price of diesel reaches record high, 28 September 2026.
- RAC Foundation — Diesel pushes through £2 a litre, 30 September 2026.
- Fuel Finder UK — UK Fuel Price Index, 2 October 2026.
- RHA — Cost Tables 2026, especially pages 7, 13, 16 and 23.
- HMRC — Reclaim VAT on business expenses.
- RHA — Haulage margin benchmark, 9 September 2026.
- RHA — Profit-per-lorry benchmark, 24 June 2024.
- RHA — Fuel survey, sample and confidence findings, 4 June 2026.
- RHA — Fuel-cost pass-through findings, 11 June 2026.
- RHA — Haulage Cost Movement 2025, page 13.
- RHA — Payload Loss Survey Report, March 2026, page 7.
- DESNZ — Statutory Security of Supply Report 2025 (2024 supply figures).
- DESNZ — DUKES 2026 (2025 annual supply data), pages 14 and 18.
- Petroineos — Grangemouth refinery and import terminal.
- Bank of England — September 2026 policy minutes.
- Bloomberg, via Rigzone — Russian diesel export restrictions, 30 September 2026.
- Reuters, via MarketScreener — Chinese product export suspension, 1 October 2026.
- RAC — Fuel Watch and pump-price components.
- HMRC — Amended Fuel Duty rates, 22 May 2026.
- HMRC — Fuel Duty and VAT on road fuel.
- US EIA — Refining crude oil.
- ONS — Consumer price inflation, August 2026, released 16 September.
- Bank of England — Clare Lombardelli speech, 24 September 2026.
- Insolvency Service — August 2026 tables, Table 1c, released 18 September.
- Bank of England — April 2026 Monetary Policy Report.
- Bank of England — July 2026 Monetary Policy Report.
- RHA — Earlier insolvency and fuel-cost commentary, 1 July 2026.
- RAC — Record diesel price looms, 23 September 2026.
- RAC — Diesel teeters on brink of record, 25 September 2026.