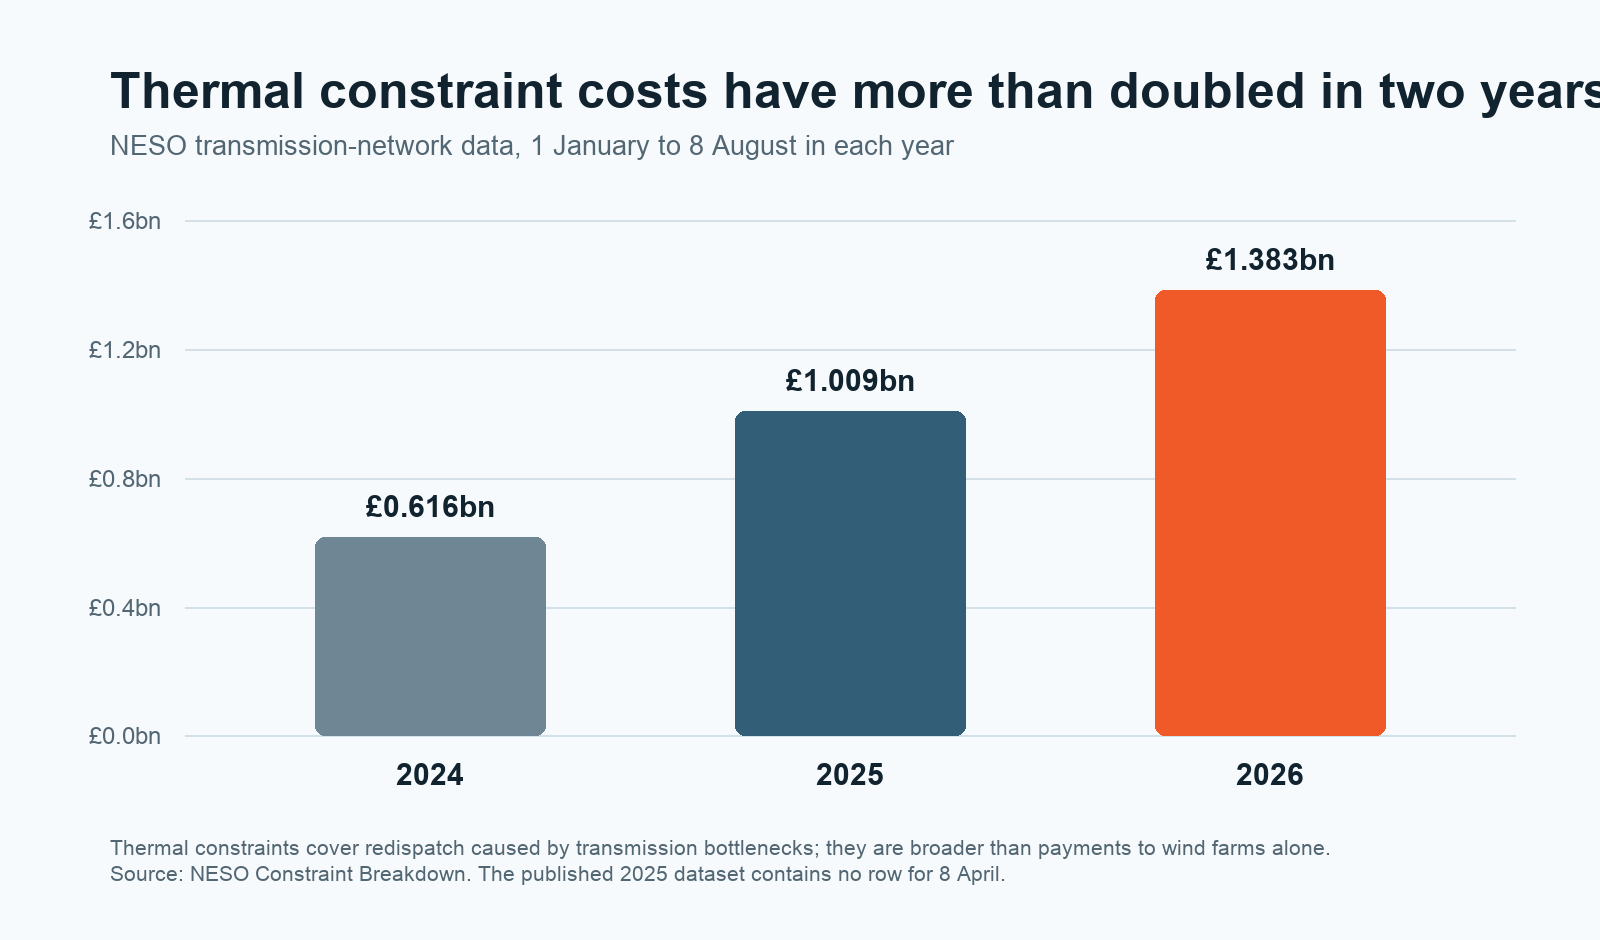
UK wind curtailment costs have accelerated sharply in 2026. The Times reports that the narrower cost of turning down wind and replacing it has already exceeded £1 billion—about £300 million more than at the same point in 2025—while a like-for-like analysis of NESO’s broader thermal-constraint data reaches £1.383 billion by 8 August. The central question is no longer whether curtailment is expensive, but why it is becoming more expensive before the measures intended to reduce it are ready.
In brief
- The £1 billion headline is real, but it is not a £1 billion cheque to wind farms. It combines wind turn-down with the cost of replacing generation elsewhere. NESO’s official thermal-constraint series is broader still and reached £1.383 billion by 8 August.
- There has genuinely been more wind to manage. DESNZ says first-quarter UK wind generation rose 30% year on year; my like-for-like calculation from NESO operational data finds metered wind output up about 22% through 8 August and accepted wind turn-down volume up about 21%.
- Network availability has fallen at important times. Planned outages, maintenance and construction in Scotland temporarily reduce safe north–south transfers. NESO says higher wind and reduced network capacity were the main reasons June constraint costs rose.
- Power prices magnify the cost. When northern wind is curtailed, NESO often has to buy more generation south of the bottleneck. June 2026 wind curtailment was lower than a year earlier, but thermal-constraint costs were almost as high because replacement power was more expensive.
- The near-term trajectory may worsen before it improves. Flexibility and dispatch reforms can help at the margin from 2026–28, but Demand for Constraints is not due to deliver until 2028, Eastern Green Links 1 and 2 are targeted for 2029, and the government’s current projection has constraint costs peaking at about £7 billion in 2030 before falling.
When I examined Britain’s wind-curtailment problem at the end of 2025, the striking number was £1.46 billion for the year. That estimate, reported by The Times and produced by Octopus Energy’s Wasted Wind tracker, separated roughly £380 million paid to turn wind generation down from about £1.08 billion attributed to replacement generation. Eight months into 2026, The Times reports that the same broad cost has already passed £1 billion.
That development deserves a new article rather than another recitation of the old one. Britain already knew that Scottish wind was being curtailed because the network could not always carry its output south. What has changed in 2026 is the intensity with which several drivers are arriving together: more installed wind capacity, much stronger wind output than in early 2025, restricted transfer capacity during network work, and higher prices for the generation NESO buys on the other side of the bottleneck.
NESO—the National Energy System Operator, which keeps electricity supply and demand balanced in Great Britain second by second—publishes a broader official series. My calculation from NESO’s daily transmission constraint data puts thermal-constraint costs at £1.383 billion from 1 January to 8 August 2026, compared with £1.009 billion over the same published period in 2025. That is a £374 million, or 37%, increase. Including voltage, inertia and largest-loss constraints takes the 2026 total to £1.578 billion, but those other services should not be relabelled as wind curtailment.
The £1 billion milestone—and what it does not mean
The first discipline in writing about constraint costs is to resist turning every number into “payments to wind farms”. The relevant measures overlap, but they describe different things.
| Measure | What it includes | What it should not be called |
|---|---|---|
| Wind turn-down payments or accepted bids | The commercial action used to reduce wind output. The payment depends on the generator’s bid, support contract and market position. | Total constraint cost |
| Wasted-wind estimate | Wind turn-down plus an estimate of the cost of replacing that energy, commonly with gas-fired generation. | A direct official NESO accounting category |
| Thermal-constraint cost | NESO’s cost of changing generation or demand because the transmission network cannot safely carry the market’s intended power flows. It includes both sides of redispatch and is not limited to wind or the Scottish border. | Payments to wind farms |
| Total balancing cost | Thermal and voltage constraints, reserve, response, system services, trading and other actions needed to operate the system. | Wind-curtailment cost |
The £1 billion Times figure is best understood as a wind-focused estimate that combines turning wind down and replacing it. NESO’s £1.383 billion thermal figure is an independently verifiable official measure of the wider network problem. It includes constraints on other generation technologies and transmission boundaries as well as the Anglo-Scottish bottleneck. The two figures therefore corroborate the scale and direction of the 2026 increase without being numerically interchangeable.
This distinction also explains why the £1.46 billion estimate for calendar 2025 should not be plotted as though it were the same series as NESO’s thermal-constraint data. Adding the daily NESO records gives a much larger figure because it covers a broader set of actions. The dramatic claim is not that one source must be wrong. It is that “curtailment payment”, “wind constraint cost”, “thermal constraint” and “balancing cost” answer different questions.
What consumers are actually paying for
Britain trades most electricity through a national wholesale market. A generator in Scotland and a generator in southern England can both sell into the same market price even though the physical network between them has limited capacity. The market schedule may therefore be commercially balanced—total generation equals expected demand—while asking the transmission system to move more electricity across a particular route than it can safely carry.
NESO corrects that mismatch through the balancing mechanism, the market it uses close to real time to buy changes from power stations, batteries and large consumers. A bid is an offer to reduce generation or increase demand; an offer is an offer to increase generation or reduce demand. When a north–south route is full, NESO can accept bids from generators north of the constraint to turn down and offers from generators south of it to turn up. The resulting change to the original market schedule is called redispatch.
Consider a deliberately simplified hour in which Scotland can produce 12 units of wind electricity, uses three locally and has cables capable of carrying six safely into England. Nine units want to move south, but only six can cross. NESO has to remove the remaining three units from the Scottish schedule. If consumers south of the bottleneck still need that electricity, NESO must procure up to three units from another source on their side of the constraint. In practice the replacement may be gas, another generator, a battery, an interconnector or reduced demand, and the exact volumes also reflect losses, reserve and system-security requirements.
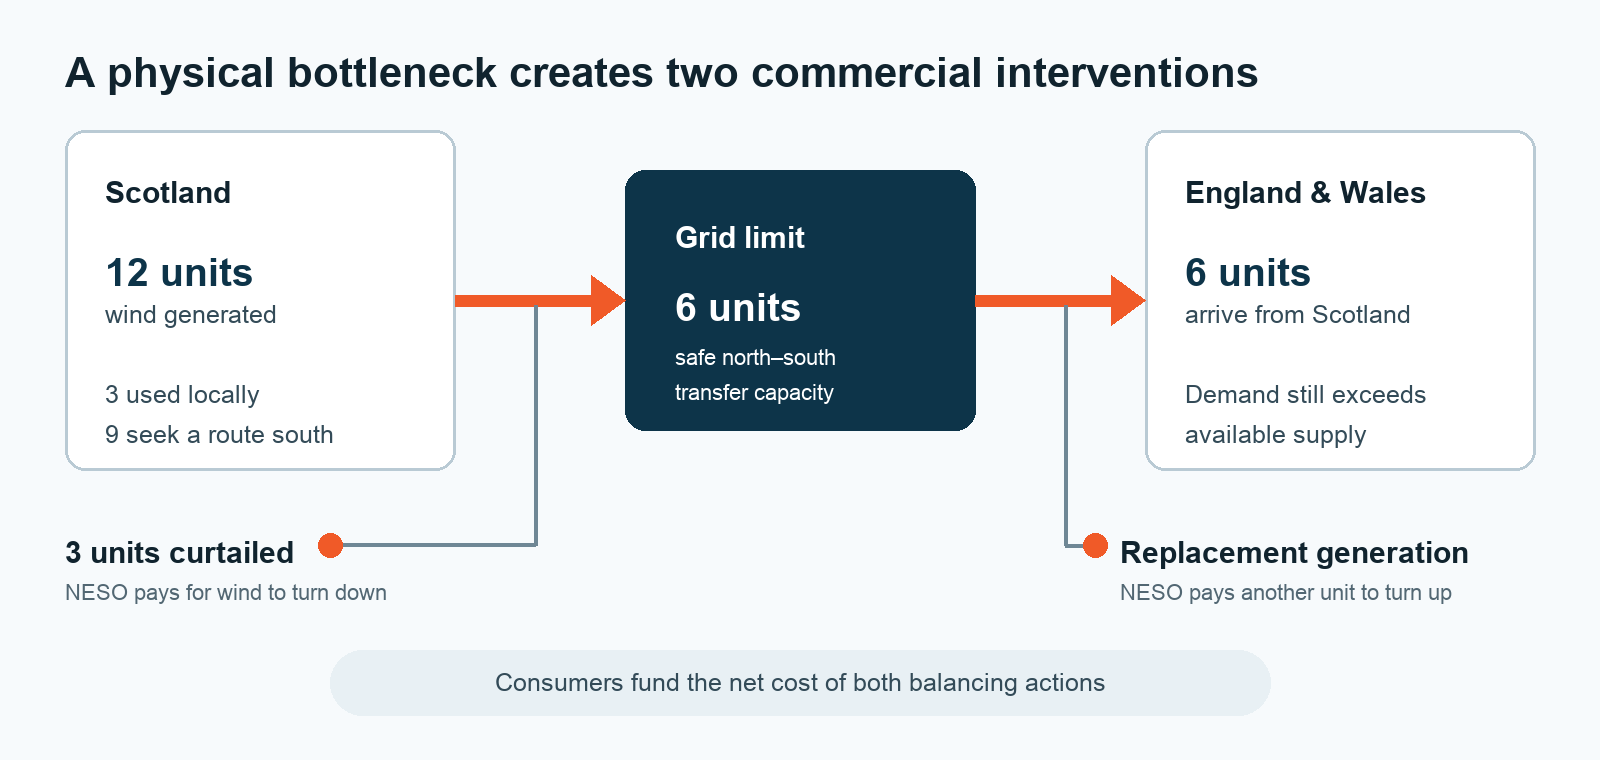
Why “paying twice” needs care. The phrase captures the two interventions, but it is not a literal rule that every curtailed megawatt-hour receives one fixed payment and every replacement megawatt-hour another. Wind farms submit different bid prices, support arrangements vary, and the replacement action may provide reserve or network support as well as energy. NESO’s 2025 balancing-cost report describes direct turn-down, replacement energy, headroom and imbalance effects within the thermal-constraint total.
Why UK wind curtailment costs are rising faster in 2026
More wind capacity met much windier conditions
The installed fleet is larger. The DESNZ Energy Trends workbook published in July 2026 shows UK onshore wind capacity at 16.64GW at the end of the first quarter, up 483MW from a year earlier, while offshore wind reached 16.73GW including floating projects, up 419MW. The combined increase was about 902MW, or 2.8%. Capacity alone did not produce the year-on-year jump in output, however.
The wind itself was stronger. DESNZ reports that UK onshore and offshore wind generation each rose about 30% in the first quarter of 2026. Installed capacity contributed, but the comparison was also against the exceptionally low wind speeds of early 2025. Wind generation reached 29.3TWh in the quarter, helping total renewable generation set a record of 43.7TWh.
The pattern persisted beyond March. My calculation from NESO’s half-hourly operationally metered wind data finds 44.6TWh of metered transmission-connected wind output from 1 January to 8 August 2026, 21.6% above the comparable 36.7TWh in 2025. Scottish metered output rose 17.9%, while England and Wales rose 24.0%. Accepted negative wind bids in NESO’s Wind BMU Bid Offer Acceptance dataset totalled about 6.70TWh, 20.5% above 5.56TWh over the same period of 2025.
These operational datasets are revised and use control-room metering rather than the settlement data used for final market accounts, so the totals should be read as a like-for-like indication rather than a final invoice. They nevertheless establish the point that 2026 has not merely felt windier: materially more wind energy has been produced and materially more has been instructed to turn down.
Reduced network capacity turned high output into higher costs
A transmission line’s nameplate rating is not the amount that NESO can transfer across it every hour. Safe capacity depends on which circuits, transformers and control equipment are available, how power is flowing elsewhere, and whether the system could survive the sudden loss of its largest relevant asset. Maintenance, fault repairs, new substations and work to connect an upgraded line can therefore reduce the safe transfer limit temporarily.
This was material in 2026. NESO’s June Monthly Balancing Cost Report says ongoing outages in Scotland, combined with higher wind, raised curtailment. Wind turn-down increased from 591GWh in May to 709GWh in June, while total constraint costs rose from £168.5 million to £225.3 million and thermal constraints from £130.5 million to £181.3 million. NESO attributes the movement principally to higher wind outturn and reduced network capacity.
The same report shows the value of managing outages intelligently. NESO estimates that changing or optimising outage plans saved £172 million during June. Deferring one outage in the East Midlands and Yorkshire avoided an estimated £18 million. This does not mean maintenance can be cancelled indefinitely: assets still need repair and reinforcement, and postponing every outage would create reliability and delivery risks. It shows that the timing of network work has become a major economic variable.
Higher power prices increased the replacement-generation bill
The strongest evidence for the price effect comes from a comparison in which wind volume moved in the opposite direction. NESO says June 2026 wind curtailment was 442GWh lower than in June 2025, yet thermal-constraint cost was only £9.5 million lower: £181.3 million compared with £190.8 million. Higher power prices made each unit of replacement and balancing energy more expensive, offsetting much of the benefit from lower curtailed volume.
In the balancing mechanism, the weighted average price of accepted offers—the instructions to increase generation—rose from £162.32/MWh in May to £175.07/MWh in June. Although June day-ahead power and gas prices had eased slightly from May, both remained materially above June 2025. A gas station south of a constraint therefore required a higher payment to produce the same megawatt-hour than it had a year earlier.
There is no defensible public-data decomposition that says, for example, 40% of the 2026 increase came from wind, 30% from outages and 30% from gas prices. The drivers interact: an outage matters more during strong wind, while a high replacement price matters only when redispatch is required. NESO’s data quantifies the change in output, curtailed volume and cost, but not an additive causal allocation. The evidence supports the mechanism without supporting invented precision.
Why Scotland and the B6 boundary are at the centre of the problem
A transmission boundary is not a wall or one cable. It is an imaginary line drawn across the network so planners can calculate how much electricity all the circuits crossing that line can carry safely under defined conditions. The best-known Scottish boundary is B6, which runs across the transmission system between the ScottishPower Transmission network in southern Scotland and National Grid Electricity Transmission in northern England—roughly, though not perfectly, along the national border.
NESO’s current Scottish-boundaries assessment gives B6 a base transfer capability of about 6.7GW. North of it sit the B4 and B5 boundaries within Scotland, with base capabilities of about 4.0GW and 3.9GW. A restriction inside Scotland can therefore prevent power from reaching B6 even when the cross-border circuits themselves appear to have room.
The scale of the coming mismatch is visible in NESO’s planning assumptions. Under its Holistic Transition pathway, Scotland could have about 38GW of generation and only around 6GW of gross demand in 2030. Output will not reach 38GW continuously, but the gap explains why local demand, storage and several export routes all matter. A single extra 2GW cable is substantial—about 30% of B6’s current base capability—but it cannot absorb every future high-wind surplus on its own.
Why building the grid can temporarily make constraints worse
Network reinforcement is not constructed beside the live system and then switched on without interruption. Engineers must connect new substations, replace conductors, upgrade a 275kV corridor to 400kV, install phase-shifting transformers that control how power divides between routes, and test protection systems. Much of that work requires planned outages on equipment that is already carrying Scottish power south.
NESO’s own planning material warns that outage interactions can create significant constraint costs and that improvements across the B4 and B6 corridors will be intermittent until the reinforcement programme is complete. The short-term paradox is therefore genuine: some of the work needed to raise transfer capacity in 2029 and 2030 reduces it for days or weeks in 2026 and 2027.
This is also why renewable deployment can worsen constraints before new grid investment lowers them. A wind farm can be consented, financed and connected in a shorter period than a major transmission route that needs land rights, environmental assessment, planning consent, specialised transformers, converter stations and long subsea cables. The government’s Reformed National Pricing delivery plan puts transmission lead times at up to 14 years. Generation, batteries and demand can often move much faster.
What is being done about UK electricity-grid constraints?
2026–28: use the existing network and flexibility better
The quickest measures do not create another north–south corridor. They reduce the number or cost of actions required while the current network is constrained.
- Better forecasting and outage coordination allow NESO and transmission owners to schedule work away from the highest-risk periods where possible. June’s estimated £172 million of outage-optimisation savings shows the potential, although weather cannot be forecast perfectly months ahead.
- Improved dispatch of batteries and smaller assets should make the balancing mechanism less dependent on large conventional stations. NESO’s Open Balancing Platform can issue many more instructions, while GC0166 went live in June 2026, allowing batteries to tell the control room more accurately how much energy they can deliver or absorb over time.
- Reducing avoidable “skip rates” means using a cheaper available battery or demand action instead of bypassing it for a more expensive option when there is no operational reason to do so. NESO reports that the control room took more than 200,000 balancing actions in June, which explains why automation and clearer asset data matter.
- Intertrip schemes automatically disconnect selected generation after a network fault. Because NESO can rely on that fast response, it can operate a boundary closer to its physical limit beforehand. An extended scheme is being developed in 2026, while NESO targets a Scottish Constraint Management Intertrip for the fourth quarter of 2027.
- Connection reform can prioritise projects that are ready and strategically useful, while better locational information can discourage new generation from deepening a constraint or encourage demand and storage to connect behind it.
The most important new demand measure is Demand for Constraints. Instead of paying only generators to change output after the constraint appears, NESO proposes longer-term contracts with large flexible consumers in constrained areas. An electrolyser, heat network, industrial process or aggregated demand portfolio could then be instructed to increase consumption when Scottish wind would otherwise be turned down.
NESO’s Constraints Collaboration Project is developing the service, but its timetable matters. The government plans a tender in 2026 for delivery from 2028, effectively using a two-year-ahead contract to give projects time to finance and build. An announcement or tender this year therefore does not reduce 2026 constraint costs. It may influence investment now and provide flexibility two years later.
2029–30: the electricity superhighways and onshore reinforcements
The structural remedy is more transmission capacity. High-voltage direct-current transmission, or HVDC, converts the grid’s alternating current into direct current for efficient, controllable long-distance movement, then converts it back at the destination. A 2GW link can move roughly the output of two large nuclear reactors and, at full power, supply electricity equivalent to around two million homes. Unlike the existing meshed alternating-current network, its flow can be controlled directly.
| Project | Capacity and route | Status at August 2026 | Current target | Constraint effect |
|---|---|---|---|---|
| Eastern Green Link 1 | 2GW HVDC from Torness, East Lothian, to Hawthorn Pit, County Durham; about 196km including 176km subsea | Construction under way; converter and cable works progressing after earlier schedule pressure | 2029 energisation | Creates a controllable route that bypasses heavily loaded Anglo-Scottish AC corridors |
| Eastern Green Link 2 | 2GW, 525kV HVDC from Peterhead to Drax; 505km, including 436km subsea | Under construction; cable installation planned for 2028 | 2029 operation | Moves north-east Scottish wind directly into Yorkshire, reducing dependence on internal Scottish and B6 routes |
| Denny–Wishaw reinforcement | New and upgraded 400kV circuits across Scotland’s central belt | Ofgem approved early construction funding in May 2026; planning and full assessment remain | Benefits sought by 2030, subject to consent | Raises transfer across the internal B5 boundary so northern power can reach southern Scotland and export routes |
| Tealing–Kincardine and associated east-coast upgrades | 400kV upgrades linking eastern and central Scotland | Early construction funding approved in May 2026 | Benefits sought by 2030, subject to consent | Strengthens the onshore system feeding existing and new east-coast HVDC links |
| Kintore–Tealing 400kV | About 106km of new 400kV infrastructure in north-east Scotland | Development and consenting programme | Early 2030 | Increases transfer from the north-east towards central Scotland and the wider export network |
For current dates, the most relevant evidence is from the project owners and regulator. National Grid’s March 2026 project update says EGL1 is expected to be complete in 2029. National Grid’s EGL2 programme retains 2028 cable installation and 2029 operation. In May 2026, Ofgem approved early funding for Scottish onshore projects intended to begin delivering benefits by 2030, while stressing that this was not planning consent.
Western Link, the existing 2.25GW HVDC route from Hunterston in Scotland to Deeside in north Wales, already provides a major bypass around B6. Its capacity is part of today’s baseline rather than a future solution. When an existing link or an associated circuit is unavailable, the constraint can worsen quickly; when EGL1 and EGL2 enter service, Britain gains two additional controllable 2GW routes rather than relying on a single major subsea bypass.
Will batteries fix wind curtailment?
A battery can help if it is connected on the constrained side of the boundary, has spare charging capacity when the wind surplus occurs and can discharge later without recreating the same network flow. It can replace an instruction to turn down wind, provide rapid reserve and reduce reliance on an expensive generator elsewhere. Those are valuable services.
Storage is not automatically a substitute for transmission. A two-hour battery can absorb two hours at its rated power before it is full; a windy system may remain constrained for a day or several days. The battery also has a finite grid connection, loses some energy during charging and discharging, and may be located south of the bottleneck where charging would increase rather than reduce the constrained flow. Once full, it cannot absorb another megawatt-hour until it has somewhere and some time to discharge.
Market instructions matter as much as hardware. A battery north of a constraint may respond to the national wholesale price by discharging when NESO needs less northern generation, or charging at a time that prevents it being available for a later constraint. NESO’s current work on “storage behind constraints”, skip rates and the new limited-duration parameters is intended to align dispatch more closely with physical value. The sensible conclusion is that well-located batteries can remove some expensive actions, while wires remain necessary for moving sustained volumes hundreds of miles.
Could hydrogen and flexible demand use the electricity instead?
An electrolyser uses electricity to split water into hydrogen and oxygen. If it is built north of a persistent constraint and can increase consumption when the boundary is full, it turns a network problem into local industrial demand. The same principle applies to heat networks, cold stores, water treatment, electric furnaces and some data-centre workloads. This is why the government is exploring stronger locational signals and why Demand for Constraints is aimed at investment-scale flexible loads rather than only short household demand events.
The electricity is not simply free. A project that operates only during curtailed hours has a low utilisation factor, meaning expensive equipment produces little annual output. An electrolyser still needs capital, a grid connection, power electronics, water, compression, hydrogen storage and a customer able to take intermittent production. It also faces network charges and market rules that may not deliver the attractive electricity price implied by a negative wholesale-price headline.
A commercially credible project therefore needs several revenues or a flexible offtake arrangement: ordinary low-price operation as well as constraint events, a long-term demand contract, the ability to store hydrogen, or an industrial customer whose process can vary. My earlier analysis of Britain’s emerging electricity glut explains why surplus power creates opportunity without eliminating infrastructure economics, while the hydrogen analysis hub covers utilisation, offtake and production-cost constraints in more detail.
Data centres can also provide a locational demand signal, especially where new facilities are able to shift some computing in time or site in Scotland rather than the already congested south-east. Yet most large facilities need continuous, high-quality power and cannot turn the whole load on only when wind would otherwise be curtailed. The detailed analysis of AI data-centre power demand and UK grid capacity shows why a large demand connection is useful only when its location, firmness and network impact are understood.
Why Britain rejected zonal electricity pricing
Zonal pricing would divide Great Britain into wholesale-market regions. When the network between two zones was congested, abundant Scottish generation could produce a lower price in Scotland while scarcity produced a higher price farther south. Generators, batteries and large consumers would then see a price that reflected their location before the balancing mechanism intervened. Supporters argue that this would reduce redispatch and encourage flexible demand to locate on the side of the boundary where electricity is frequently surplus.
The government rejected that model in 2025. Its Review of Electricity Market Arrangements decision concluded that uncertain future zone boundaries and generator revenues could raise financing costs, slow investment and create difficult distributional effects between regions. Suppliers could add risk premia to tariffs, while implementation was assessed as taking around seven years. The concern was not that location is economically irrelevant, but that a full zonal redesign might impose investment uncertainty during an already compressed build-out.
Reformed National Pricing is the alternative. Britain retains a national wholesale price while attempting to strengthen locational signals through network charges, connections, planning, constraint services, intertrips, dispatch reform and contracts for flexible demand. This is less disruptive than creating zones, but its success depends on whether those separate measures change investment and operations quickly enough. It should not be presented as an immediate replacement for the price signal that zonal advocates wanted.
When will UK wind curtailment costs actually fall?
The honest answer is later than many policy announcements imply. The government’s April 2026 delivery plan says current projections have constraint costs peaking at around £7 billion in 2030 before falling as transmission capacity increases beyond 2030. It estimates that accelerating three important projects from 2031 to 2030 could avoid about £4 billion of cost in 2030, while the eventual Reformed National Pricing package could save up to another £1 billion that year. These are modelled savings against a counterfactual, not cash already secured.
Evidence-based timeline
- Remainder of 2026: Costs are likely to remain exceptionally high and may set another record. Strong wind, constrained Scottish transfer capacity and higher replacement-power prices remain active. Boundary-flow smoothing work is complete, battery dispatch improvements are rolling out, and the Demand for Constraints procurement is being designed, but none adds a new 2GW route this year.
- 2027: Better forecasting, dispatch software, storage participation and intertrip arrangements should reduce some actions or their unit cost. The Scottish Constraint Management Intertrip is targeted for late 2027. These measures improve use of the existing network without eliminating its north–south deficit.
- 2028: Demand for Constraints is scheduled to begin delivery, subject to a successful tender and projects being built. EGL2 cable installation is planned. Batteries and flexible demand should have a larger role, although results will depend on location and operational incentives.
- 2029: EGL1 and EGL2 are both currently targeted to enter service. Their combined 4GW of controllable HVDC transfer is the first change large enough to alter the physical constraint materially, provided associated onshore networks and commissioning remain on schedule.
- 2030 and early 2030s: Denny–Wishaw, Tealing–Kincardine, Kintore–Tealing and other reinforcements are intended to strengthen the network feeding and receiving the new links. The official central message is still “worse before better”: costs may peak around 2030, then fall as the fuller network arrives. Delay to a small number of critical projects would keep the peak higher for longer.
Older commentary often cites £8 billion or £10 billion. Those figures come from different forecasts, scopes and counterfactuals and should not be mixed with the current official projection. The latest government delivery plan uses approximately £7 billion for total constraint costs at the 2030 peak. That is not the same as wind turn-down payments, thermal costs in one completed year or total balancing costs. NESO says thermal constraints currently account for about 60% of balancing costs, which is why the network programme dominates the outlook even though balancing reform still matters.
Britain is paying for a transition built on different schedules
The 2026 increase does not show that wind generation is economically irrational, and it is too large to dismiss as an incidental transition cost. It shows that the value of cheap generation depends on whether electricity can be moved, stored or consumed when and where it appears.
Britain has connected more wind into a year with much stronger output than early 2025. At the same time, work on the Scottish network has restricted transfer capacity, while higher power prices have increased the cost of replacing curtailed generation. The interaction of those factors explains why the bill has risen faster than curtailed volume alone.
The remedies also operate on different clocks. Control-room software and outage optimisation can improve within months. Batteries, flexible industry and Demand for Constraints require contracts, connections and investment, with meaningful delivery beginning later. EGL1 and EGL2 do not change physical transfer capacity until 2029 if their current programmes hold, and several associated onshore upgrades arrive around 2030.
That leaves a difficult but intelligible late-2020s period. Constraint costs can continue rising even while Britain is doing many of the right things to reduce them, because renewable generation is arriving before the infrastructure and market arrangements that make it fully usable. The test is whether short-term flexibility contains the cost until the large transmission projects enter service—and whether those projects arrive before another wave of generation deepens the mismatch.
Frequently asked questions
How much have UK wind curtailment costs reached in 2026?
The Times reported on 11 August that the combined cost of turning down wind and replacing it had exceeded £1 billion. NESO’s broader official thermal-constraint data totalled £1.383 billion from 1 January to 8 August 2026, up 37% on the same published period of 2025. The two measures have different scopes.
Does the whole cost go to wind farms?
No. NESO pays for changes on both sides of a constraint: generation may be reduced in Scotland and increased south of the bottleneck. In 2024/25, the government says roughly two-thirds of constraint cost came from replacement generation, including £910 million of replacement payments.
What is the B6 boundary?
B6 is a planning boundary across the transmission network between southern Scotland and northern England. It represents the safe combined transfer across the circuits connecting the two regions, not one physical cable. NESO currently gives it a base capability of about 6.7GW.
Why is wind curtailment worse in 2026?
There is more wind capacity, wind conditions have produced much more electricity than in early 2025, Scottish network outages have reduced transfer capability, and higher power prices have made replacement generation more expensive. NESO’s public data shows each mechanism but does not support a precise additive percentage for each cause.
When will Eastern Green Link reduce Scottish wind curtailment?
Eastern Green Links 1 and 2 are each rated at 2GW and are currently targeted for 2029. They should materially increase controllable north–south transfer, but their full benefit depends on associated onshore reinforcements and successful commissioning.
Will constraint costs fall before 2030?
Some flexibility and dispatch reforms should help before 2030, but the current government projection has total constraint costs peaking around £7 billion in 2030 and falling afterwards as major transmission reinforcements enter service. The timing is highly sensitive to project delivery and new renewable connections.
Sources and further reading
- NESO, balancing costs and monthly reports.
- NESO, Constraint Breakdown open dataset.
- NESO, Monthly Balancing Cost Report, June 2026.
- NESO, explanation of constraint payments.
- DESNZ, Reformed National Pricing delivery plan, April 2026.
- DESNZ, Energy Trends renewable capacity and generation, July 2026.
- NESO, Scottish transmission boundaries and requirements.
- Ofgem, early construction funding for Scottish network projects, May 2026.